Path to Purchase; the Nepa approach

Karen Chandler
Share this article:
500%. That’s the increase in touchpoints that our clients have tracked over the last five years. Banner ads. PPC. Print ads. TV commercials. Blogs. In-person events. Webinars. Catalogues. OOH. Referrals. Sponsored social posts. Organic social search. Influencers. Emails. These are just some of the ways your consumers can interact with your brand every single day. The shopper journey is no longer a linear ‘path to purchase’ – every shopper journey is as different as every shopper. So how can brands quantify these effects in the omnichannel, always-on, world?
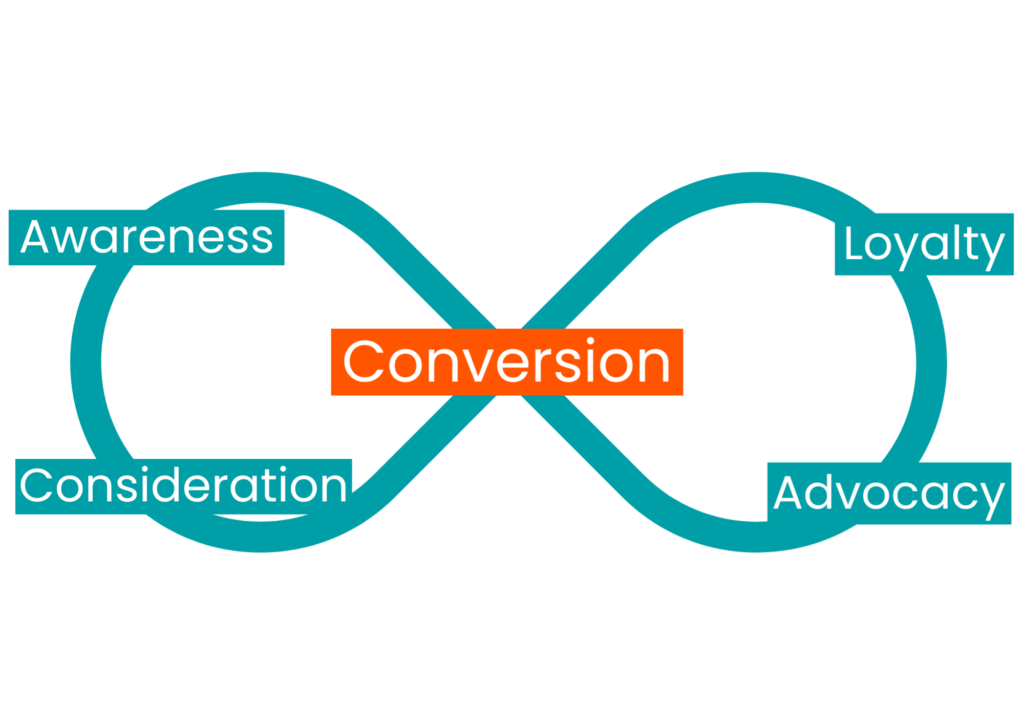
Traditionally, the shopper marketing funnel views the consumer journey as a straight path from awareness to conversion. But the shopper marketing funnel was made for the old, pre-digital world. We see in our Path to Purchase studies that consumers now bounce around between stages, and there has been a massive diversification of consumer behaviour. The funnel has become an infinite loop with conversion at its centre.
Measure your touchpoints with the same yardstick
But with a proliferation of online and offline touchpoints, how do you know which touchpoints are strongest at driving conversions, which ones need re-thinking, and where the whitespace lies to make the most out of your time and resources? How do you measure every single touchpoint with the same yardstick, when many platforms ringfence their analytics and data protection laws become increasingly more stringent?
The whole journey needs to be measured to capture reality. Everything that a consumer experiences before a store, in the store, and after they’ve visited to capture each individual path to purchase. Without doing so risks misattribution. The right approaches and tools are needed to measure what happens, when it happens.
The Nepa Path to Purchase approach
We use a unique approach that combines continuously measured self-stated and behavioural data that enables us to map each individual path to purchase. By blending the two, brands get a fuller understanding of the ‘what’ and the ‘why’ of all touchpoints, and takes into account any cross-channel effects that may otherwise be missed. From this, detailed reports can be created that highlight the most influential factors driving consumers to convert.
Global powerhouse brands have used this information to tap into new audiences, increase basket frequency by leveraging omnichannel shopping behaviour, and drive up trade by understanding what their consumers want and where.
Our Path to Purchase recommendations
If you’re new to this way of measuring your consumer journeys, there are five things we recommend brands do in order to tame the chaos:
Bring all your data points onto the same playing field
You can’t improve what you can’t track. If you’re measuring your digital, physical, paid, unpaid, owned, and earned touchpoints in different ways, with different tools, in different teams, you’re going to be making decisions based on incomplete data.
Focus on the one metric that truly matters: Conversion
Everything a marketer and insights professional does should be towards one goal – Driving growth. Understanding the touchpoints that have the most impact to the most people means even small teams can optimise their marketing efforts for maximum impact.
Collect what happens, as it happens
Memories fade, so if you’re not collecting self-stated and behavioural data at the same time, it is easy to misattribute conversions to different touchpoints. Did the shopper buy your brand because they saw it in-store, or were the paid social media posts and UGC a more important part of their journey?
Map the entire journey
Nothing happens in a silo, so you need to understand the cross-channel effects of both online and offline marketing. Do your consumers experience a seamless experience across all platforms, or is there friction you need to improve upon to drive future growth?
If you would like some help simplifying and clarifying your complex consumer path to purchase, why not get in touch? We will also be hosting a webinar on the topic on the 28th August 2024 at 11.00 BST / 12.00 CEST. Find out more here.