Connect

Stockholm (HQ)

Maria Skolgata 83
Stockholm, Sweden

Blog Posts
Back

Unveiling the mystery of brand tracking: The top questions answered by trackers

May 10, 2023

Portrait of pensive business woman wearing glasses at workplace in office. Young handsome female worker using modern laptop

Robert Beatus


Share this article:


To kick off our series on the ins and outs of brand tracking we are starting with the basics. More specifically, the types of business questions a brand tracker can answer. In our perspective here at Nepa, brand tracking is an essential business tool to make informed business decisions. Unfortunately, many companies tend to underuse their brand trackers. It’s often primarily used to measure KPIs for internal reports, with results only looked at every month or quarter. However, to stay ahead as a brand in an ever-evolving world, it is crucial to continuously measure, analyse and adapt your business strategies. Here is where really making the most of your tracker comes into play.

Tips to increase the value of your brand tracker: Check your measurements

A well-designed tracker can answer a broad set of business questions. These go beyond the basics of simply following some sort of brand funnel or key management KPIs such as consideration, preference, and purchase/usage perspectives. Some of the typical questions that a Nepa brand tracker can answer include: 

Brand awareness: To what degree are people aware of your brand, and are your marketing efforts paying off?

Brand and competitor perception: How do people perceive your brand and your competitors? Are you seen as trustworthy or untrustworthy, innovative or old-fashioned? How do you compare to your competition?

Marketing impact: Are your marketing campaigns resonating with your target audience, and do they have a lasting effect? What actions should you take to optimise your marketing strategy?

Market drivers: Is your brand truly answering the needs and expectations of the market that are the true drivers of consideration or sales? Do you differentiate yourself on these factors when compared to your competition?

Customer loyalty: Are your customers more loyal to you or your competitors? What drives customer loyalty, and how can you improve customer retention?

Target audience: Who are the consumer groups that are most attracted to and purchase your brand, and how do they relate to the competing offerings out there?
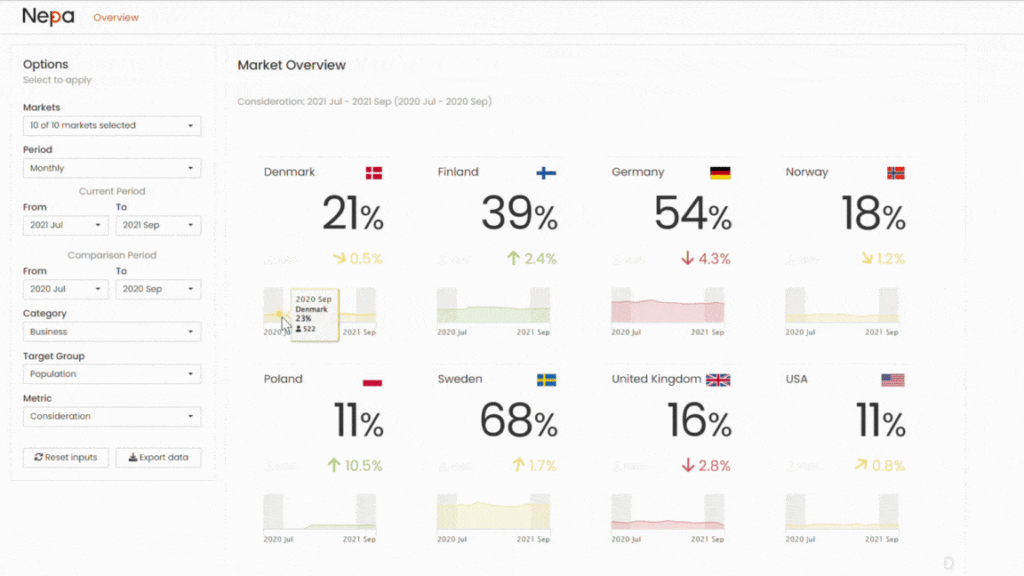
Brand Tracking Dashboard Market's View

Tips to increase the value of your brand tracker: Focus on core business questions

If you want to elevate your brand tracking and make it an even stronger business tool, there are some additional things to consider in choosing both set-up and supplier:

1. The set of attributes that you include in your tracking is crucial to define how your brand, and competing brands, is seen by your consumers. If the attributes measured are not truly comprehensive, it will give you the wrong picture of your brand’s position, increasing the risk of making wrong business decisions.

2. A continuous brand tracker is far more useful as a business tool than those performed periodically in dips quarterly, or even annually. With a continuous tracker, you get several advantages that are crucial in a world where constantly changing demands is the only thing you can be sure of. In addition, this approach creates a granular time-series of data that can be connected to other continuous data sources, such as sales, visits, etc. This then offers completely new arena of analytical possibilities using predictive modelling and econometrics.

3. Often when setting up a brand tracker a lot of focus, and rightly so, is on getting your competitor list right and deciding on which brand associations to include. Less time is spent on background questions, which offer the possibility to add further dimensions such as target groups or situational perspectives. What you miss if these questions are not relevant to your category and carefully considered is the possibility to take the analysis, and thus the value of the insights, to the next level.

4. The possibility to calculate the value or equity of your brand is something that some brand trackers claim to be able to do, but are they really? It is essential to use a tracking module that truly delivers on the need to understand brand value. We at Nepa pride ourselves with our Willingness to Pay module that truly delivers. It is based on cutting-edge conjoint methodology that has been adapted work alongside continuous brand tracking, offering you insights into the true value the market is applying to your brand compared to competing brands. It means no more guesswork, no strange index solutions that are hard to explain internally, just a simple figure measured in your own currencies.

5. Your supplier should be an expert at analysing tracking data. Challenge them, and if you do not get even more value from the data that you are already collecting, simply change the supplier. Don’t get caught up in a sunk coast fallacy.

In conclusion, brand tracking is an always-on measure of how your brand is performing and how your market, customers, and prospects are changing. To maximize the value of a tracker, choose a well-designed solution that can answer a broad set of business questions, and consider our additional tips to take it to the next level. 

This post was co-written by Lars Pahlman, Senior Director, and Robert Beatus, Head of R&D.

Blog Posts
Back

The CX Loyalty Metrics that Actually Matter

October 25, 2019

CX Loyalty Metrics Nepa

Robert Beatus


Share this article:


A key challenge of implementing a CX program is demonstrating its value up and down the organization. To do that, you have to show that it delivers results. There are no shortage of metrics available, but that’s part of the challenge: big data doesn’t always mean big insights. How do you identify the metrics that really matter?

While what matters will differ from company to company and even unit to unit, there are some basic principles that apply. You need to have a 360 degree view of the customer, one that includes both observed and stated loyalty as well as behavioral and emotional characteristics. You want to identify metrics that clearly deliver business value and, ultimately, drive an increase in revenues and a growing customer base.

READ ALSO: Brand tracking is key to increase brand awareness

As a first step, you have to define the most effective KPIs. To do this, you need to understand and define how loyalty drives your business and which types of loyalty are most important. There are stated and observed emotional metrics, and stated and observed behavioral metrics. Each has its value, depending on what you want to do and the audience, but it is generally agreed that from a customer point of view emotional loyalty is more enduring than behavioral loyalty and observed behavior more insightful than stated behavior. Still, each has something to add to the overall picture.

Keeping in mind that there is no real “magic bullet,” what tools are available to help you capture the metrics that actually matter? We have identified six.

1. Net Promoter Score

The Net Promoter Score (NPS) has gained huge traction in the last ten years, with the consulting firm Bain and others claiming it’s the only data point needed to predict consumer behavior. This seems to us overly optimistic. The metric divides customers into three categories: detractors, passives, and promoters. The score is determined by subtracting the percentage of detractors from the percentage of promoters. It’s an important number and can be very effective in change management because it’s easy to understand.

READ ALSO: Brand research: What is it & why is it important?

2. Repurchase Intent

Repurchase Intent is another good metric. This seeks to measure loyalty by tracking a customer’s intent to stay a customer. It’s especially powerful for subscription-based services as it implicitly incorporates barriers to switching.

3. Cross Selling

Cross Selling is a good number, too. It captures existing customers intent to buy more products or services from a company, an important indication of loyalty and a powerful tool for growing the business.

4. Price Tolerance

Price Tolerance is another way to measure just how loyal your customers are. Are they willing to pay more for your product? How much more? The preference for your products versus your competitors at various price points can reveal a lot about their loyalty.

READ ALSO: Benefits of Path to Purchase analysis

5. Customer Loyalty Index

The Customer Loyalty Index (CLI) is a standardized measure designed to track loyalty over time. It incorporates the values of NPS, repurchase intent, and cross selling. While this would seem to be an interesting metric, in practice it’s often hard to understand and its value difficult to communicate. Most users will find its constituent metrics more valuable as standalone tools.

6. Share of Wallet

Finally, there is Share of Wallet, a metric that measures how consumers divide their spending among various brands in a specific category. This tool works best for fast moving consumer brands and can offer insights into relative strength and market share. It’s less helpful for modelling purposes and, like CLI, can be hard to communicate.

READ ALSO: CX is a game changer – here is why

Why loyalty matters

Few businesses can survive for long without customer loyalty. No one can stay ahead of the competition all the time, and loyalty buys you breathing space, it allows you to experiment with new products and services and to make the occasional mistake. CX is designed to provide insight into how to develop and grow that kind of loyalty.

But simply implementing a program is not enough: you have to prove its value every day. To do that, you have to measure, and to make your measurements effective, you have to have the right metrics. Those metrics, in turn, must be selected for their ability to generate business value.

Blog Posts
Back

Why a recession is a good time to ramp up marketing

October 10, 2019

Robert Beatus


Share this article:


After a record 10-years plus of economic growth, the U.S. and other parts of the developed world are starting to worry about recession. If history is any guide, many retailers and CPGs will take a close look at their marketing spend as a potential source of savings should growth falter. In doing so, they may be missing an opportunity to invest for the long term and to build market share.

Companies have typically reacted in two ways to a slowdown: they cut costs across the board, including marketing, and they seek to optimize the remaining marketing spend, focusing on activation and ignoring brand. This is short sighted. Brand is a key determinant in the path to purchase, while brand loyalty is expensive and time-consuming to build, but easy to squander. As an article in the Harvard Business Review (HBR – How to Market in a Downturn) put it, “Building and maintaining strong brands—ones that customers recognize and trust—remains one of the best ways to reduce business risk.”

READ ALSO: Power-up your Marketing Mix with brand expertise and data science

There are other advantages to continuing to maintain marketing spend during a slowdown. Competitors may cut back, allowing others to capture a larger share of voice. As demand for advertising space declines, media pricing becomes more favorable to the buyer, meaning you get more impact for the same amount of money, or the same amount of impact for less money. In short, there’s a chance to capture market share.

We know of one consumer retailer that decided to cut its media budget by about 15% and to reallocate significant parts of the remaining budget from brand building to activation. The idea was to invest more in price promotion, drive short-term sales, and cut costs. (The decision was not based on media or sales modeling optimizations.) The result was a drop in sales of almost 10% the following year and even more damage to the brand. Later analysis showed that media investment had contributed about 20% of sales and that investments in traditional brand building channels had been an important part of the program’s overall effectiveness.

In that same Harvard Business Review article, the author wrote that, “marketers may forget that rising sales aren’t caused by clever advertising and appealing products alone. Purchases depend on consumers’ having disposable income, feeling confident about their future, trusting in business and the economy, and embracing lifestyles and values that encourage consumption.” All these are challenged during a slowdown – making brand a more important factor in whether a customer stays with your product or finds an alternative.

“CMOs across the board are seeing shrinking budgets and increasing expectations. And with that, demand for more transparency around how their marketing investments are performing and effecting their long-term brand is more important than ever,” says Robert Beatus, Head of Research Design at Nepa. “Understanding today’s complex shoppers requires sophisticated analytical techniques like Marketing Mix Modeling (MMM), Attribution Modelling and other emerging marketing analytics.”

READ ALSO: What is brand tracking and why is it important?

One of the most promising analytical methods to recently develop is the space of Path-to-Purchase (P2P) analytics. It helps marketers measure changes to shopper psychology, as priorities are reassessed and new behavior patterns emerge, based on the touchpoints and combinations of touchpoints they experience on the way to buying a product or service. In a recession, shoppers are more open to switching brands or retailers, and P2P can help identify the reasons for that switch. As it does so, it simultaneously improves the ability to invest in the touchpoints that increase conversion, always an important function, but even more important during a slowdown.

On the corporate balance sheet, marketing is often treated as an expense rather than as an investment. In practice, it is an investment in the future growth of the company. Investing in marketing during a recession may allow a retailer or CPG company to expand market share, attract new consumers, and position its products for faster growth when the recession ends.

Blog Posts
Back

Consumer journeys become more and more complex

May 26, 2017

Robert Beatus


Share this article:


And changes in behavior happen faster than ever. Consumers learn about products, compare prices, share opinions, consume content, and make their decisions where and when it best serves them on their consumer journey – their path to purchase. Different websites, devices, store channels and media types (both online and offline) interact to impact consumers throughout their journey. This forms the consumer experience that is ultimately decisive for the success or failure for brands and retailers.

To make things even more complex, consumers’ paths to purchase are highly different for different consumer segments, purchase channels and shopper missions. Most CPG (Consumer Packaged Goods) giants and top retailers agree with the importance of an omnichannel perspective on the consumer experience. However, most of them have yet to move beyond single-channel tactics.

The gap between online and offline shopper insights

There is one big challenge that companies who do not choose to move into an omnichannel perspective face. It is the lack of easy-to-implement and robust research methods to ultimately measure consumers’ omnichannel paths to purchase. Which online and offline touchpoints should be prioritized for brand building and ultimately conversion? Currently, most CPG companies have a good understanding of how their shoppers are behaving; both online and offline. However, this understanding often does not link the online and the offline world together. It also does not link how shoppers are interacting and behaving across the entire Path to Purchase.

READ ALSO: Benefits of Path to Purchase analysis

There are several reasons why marketing research methods are not able to uncover the omnichannel path to purchase.

Let’s go through the most common approaches:

1. Self-stated surveys, after completed purchase

The most traditional way of researching path to purchase is asking consumers about their Path to Purchase, the touchpoints they’ve encountered leading up to purchase, and the impact they’ve had on them. This method allows for mapping of typical Paths to Purchase, including all types of touchpoints. However, it is difficult for people to simply tell which specific touchpoints made them take a specific action. Thus, this method gives very limited insight into the impact of different touchpoints.

2. Monitor consumers’ digital behavior

This method has a higher validity since it’s based on actual behavior. However, it only links to online behavior not capturing the interaction between online and offline interactions, missing the central omnichannel aspect of path to purchase. Moreover, in general companies do not have access to online purchase data from different e-retailers, making conversions impossible to capture. Another consideration for this approach is that it generates a TON of data – so be sure to probe an agency on their data engineering and data science chops.

READ ALSO: Brand research: What is it & why is it important?

3. Qualitative research

Focus groups, online diaries, or in-depth interviews enable research to dig deeper into consumers reasoning and motives behind behaviors. Qualitative methods are therefore widely used to understand Path to Purchase. The main problem with using a qualitative approach is that it does not quantify either your finding or measure the impact of individual touchpoints.

4. Marketing Mix Modeling (MMM):

In this method, advanced statistical modeling is applied on historical data on media spend and sales. Marketing Mix Modeling does not rely on surveys, and as such is free from any research biases. It also allows for understanding the impact of individual touchpoints which guides media planning. However, MMM requires high quality time series data of all relevant media spend and sales. This is difficult for media owners to get a hold of.

Further, relying on historical media spend, MMM can only assess the media channels used by the advertiser historically, not revealing anything about the potential of new media channels, nor touchpoints that can’t be quantified by media spend (e.g. recommendations from friends, or key category influencers). Moreover, interactions between and sequences of touchpoints are very difficult to capture with MMM.

Do you recognize the challenges above?

I understand if it’s hard to find a research methodology to capture Path to Purchase across channels. Please share how you have solved this situation by writing in the comments section. Otherwise, you’re most welcome to get in touch with me to discuss this subject.

What methods does your company use to understand Path to Purchase?

Nepa´s approach to map consumers’ omnichannel Path to Purchase is to use both monitored and self-stated data. We do this by collecting individual single source data (both attitudinal and behavioral) through a focused panel of respondents for a limited time period (via web scraping, browser monitoring, app monitoring, and a self-reporting portal).

This way we can capture all touchpoints that consumers interact with, as well as their actions (e.g. makes a store visit or purchase) not limited to bought media or owned channels. By modeling this data, we help our clients understand the impact of individual touchpoints and the combinations of them. As a bonus, we use trigger-based surveys to capture motivations behind actions and experiences of touchpoints. The output allows for:

  1. Optimizing marketing budget.
  2. Informing campaigns and content strategies.
  3. Informing retailer-specific insights. All insights are omnichannel context, and are not limited to bought media touchpoints.

“The output gives our clients an actionable framework to make market-by-market decisions about how to focus their media, marketing, and sales investments along the Path to Purchase.”

I help businesses to thrive with customer-centricity by utilizing the power of continuous consumer insights. There is no end to what you can achieve with real-time consumer insights, customer feedback, and footprints. Do you want to know more about our approach or share your view on these challenges? You’re most welcome to get in touch with us. 

Robert Beatus
Head of R&D at Nepa

Blog Posts
Back

Omnichannel Perspective on Path to Purchase

February 23, 2017

Robert Beatus


Share this article:


Consumer journeys become more and more complex

and changes happen faster than ever. Consumers learn about products, compare prices, share opinions, consume content, and make their decisions where and when it best serves them on their path to purchase.

Different websites, devices, store channels and media types (both online and offline) interacts and impact consumers throughout their journey. This forms the consumer experience that is ultimately decisive for the success or failure for brands and retailers. To make things even more complex, consumers paths to purchase are highly different for different consumer segments; purchase channels and shopper missions. Most CPG (Consumer Packaged Goods) giants and top retailers agree with the importance of an omnichannel perspective on the consumer experience. However, most of them have yet to move beyond single-channel tactics.

READ ALSO: Benefits of Path to Purchase analysis

The gap between online and offline shopper insights

There is one big challenge that companies who do not choose to move into an omnichannel perspective face. It is the lack of easy to implement and robust research methods to ultimately measure consumers’ omnichannel paths to purchase. Which online and offline touchpoints should be prioritized for brand building and ultimately conversion? Currently, most CPG companies have a good understanding of how their shoppers are behaving; both online and offline. However, this understanding often does not link the online world to the offline world together. It also does not link how shoppers are interacting and behaving across the entire Path to Purchase.

There are several reasons why marketing research methods are not able to uncover the omnichannel paths to purchase.

Let’s go through the most common approaches:

  1. Self-stated surveys: The most traditional way of researching path to purchase is asking consumers about their Path to Purchase, the touchpoints they encounter, and the impact they’ve had on them. This method allows for mapping of typical Paths to Purchase, including all types of touchpoints. However, it is typically difficult for people to simply tell which specific touchpoints made them take a specific action. As a result, this method gives very limited insight into the impact of different touchpoints.
  2. Monitor consumers’ digital behavior: This method has a higher validity since it’s based on actual behavior. However, it only links to online behavior not capturing the interaction between online and offline interactions; which is the central aspect of omnichannel paths to purchase. Moreover, companies do not have access to online purchase data from different e-retailers which is why conversions cannot be captured.
  3. Qualitative research: Focus groups, online diaries, or in-depth interviews enable research to dig deeper into consumers reasoning and motives behind behaviors. Qualitative methods are therefore widely used to understand Path to Purchase. The main problem with using a qualitative approach is that it does not quantify either your finding or measure of the impact of individual touchpoints.
  4. Marketing Mix Modelling (MMM): In this method, advanced statistical modeling is applied on historical data on media spend and sales. MMM does not rely on surveys. Therefore it is free from any research biases. It also allows for understanding the impact of individual touchpoints which guides media planning. However, MMM requires high quality time series data of all relevant media spend and sales. This is difficult for media owners to get a hold of. MMM is also limited to the media channels used by the advertiser historically. Moreover, interactions between and sequences of touchpoints are very difficult to capture with MMM.

READ ALSO: Brand research: What is it & why is it important?

Do you recognize the challenges above?

I understand if it’s hard to find a research methodology to capture Path to Purchase across channels. Share how you have solved this situation by writing in the comments section. Otherwise, you’re most welcome to get in touch with me to discuss this subject.

What methods does your company use to understand Path to Purchase?

Nepa’s approach to map consumers’ omnichannel Path to Purchase is to use both monitored and self-stated data. We do this by collecting individual single source data (both attitudinal and behavioral) through a focused panel of respondents for a limited time period (via web scraping, browser monitoring, app monitoring, and a self-reporting portal). This way we can capture all touchpoints that consumers interact with. As well as their actions (e.g. makes a visit or purchase) not limited to bought media or owned channels. By modeling this data, we help our clients understand the impact of individual touchpoints and the combinations of them. As a bonus, we use trigger-based surveys to capture motivations behind actions and experiences of touchpoints.

“The output gives our clients an actionable framework to make market-by-market decisions about how to focus their media, marketing, and sales investments along the Path to Purchase.”

I help businesses to thrive with customer-centricity by utilizing the power of continuous consumer insights. There is no end to what you can achieve with real-time consumer insights, customer feedback, and footprints. Do you want to know more about our approach or share your view on these challenges? You’re most welcome to get in touch with me.

Robert Beatus
Head of R&D at Nepa

Blog Posts
Back

A study about the future of journalism

February 18, 2017

Robert Beatus


Share this article:


Introducing the voice of the consumer

The major media players in Sweden have developed the prerequisites for the future of journalism. As a result, nine focus areas are identified of which lead to research projects at Stockholm School of Economics (HHS).

Shown in the media:

Dagens Nyheter 1

Dagens Nyheter 2

Resumé

Dagens Media

Nepa conducted a study of the future of journalism where different data sources combine.

The basis of the analysis has been on consumers´ actual behavior within the largest news sites in Sweden as well as their inner motivations to news consumption. In addition, these studies were based on editorial content; unlike most other panel studies based on the ad business.

The analysis is based on digital behavior of 38,000 unique individuals. Specifically, these individuals are from Aftonbladet, Dagens Nyheter, Expressen, Svenska Dagbladet, Sveriges Radio, Sveriges Television, and Upsala Nya Tidning; in other words, Sweden’s largest news sites.

The digital footprint was supplemented with survey studies with 4,000 participants. Specifically, they were interviewed about six topics; media attitudes, news consumption, privacy, sharing behavior in social media, news commitment, and quality associations.

The nationally representative sample were aged from 15-74 years old and were drawn from the Nepa panels. These panels are consisting of approximately 350,000 consumers in Sweden.

READ ALSO: Brand research: What is it & why is it important?

The research projects will continuously measure behavior given the new realities of the outside world

Nepa introduced the voice of the consumer in the discussion on the basis of six consumer-related focus areas. These include:

  • News consumption in different segments
    • What are the different target segments?
    • Where do they consume the news today and what motivates them?
    • What are the needs of news and news formats they have today?
  • Viral behavior
    • What content can be shared with others?
    • What drives sharing in social media?
    • How is the shared content be perceived?
  • Commitment
    • What kind of commitment is there?
    • What drives commitment?
  • Quality associations digital media
    • What quality associations create a will to pay high perceived value in journalism?
  • The future news format
    • What are the future consumer needs of news and news formats?
  • Personal integrity
    • How does the perception of integrity differ among different segments of the target audience?
    • How does the need for integrity change over time?
    • In what way do different media brands affect consumers’ attitude?
    • How much information will different target groups want to share in the future? What will be their counterclaims?

Summary of the study

The market for news consumption is traditionally based on age, gender, or lifestyle. Therefore, by using consumers’ actual behavior and underlying driving forces, new segments for news consumption can be identified.

The new segments reveal three different groups whose needs are not being addressed today by traditional media. The three new segments satisfy their needs digitally with new types of media formats. In addition, these segments represent approximately 50% of the Swedish population.

However, the segments have different reasons for being active on social media. Some segments are using social media to influence the opinions of others. This is opposed to others whom use social media to enhance the image of themselves in their own network.

Furthermore, the study shows that there is a no one single way to attract the groups that are currently not addressed by traditional media. For example, there are consumers who question the independence of traditional media. While other consumers question the ability to focus on personalized and interactive content. Additionally, there are also consumers looking for more depth and context. Therefore, all these consumers feel that they can’t find this in traditional media.

READ ALSO: Optimize your marketing budget with Markting Mix Modeling

New consumer segments

The market for news consumption traditionally has been segmented based on age, gender or lifestyle. However, this may be because of the advertising market’s way of dividing consumers based on communicative audiences.

Therefore, to find new insights about consumers’ news consumption, the basis for segmentation focuses on the attitude and the drive of news consumption. Additionally, there is also a focus on the actual behavior of the news sites.

Six different segments identified are:

The Enthusiastic 15%

  • Large news commitment
  • Consumes news in all channels but prefers analog channels

The Traditional 13%

  • Has a high commitment to innovation and community
  • Consumes mainly traditional media in the analog channels

The Dutiful 18%

  • Consumes news because they feel they have to keep up
  • Appreciates objectivity

The Following 13%

  • Has a high commitment to news
  • Inspired by news
  • Follows others on social forums in search of news

The Social 20%

  • Is the least present on digital services of traditional media
  • Socially driven in their news consumption
  • Inspired by news

The Distrust 21%

  • Is less present at digital services of traditional media
  • Socially driven in their news consumption
  • Distrusts traditional media
  • Appreciates objectivity

News consumption among segments

Within three of the segments, traditional media has a specific challenge; the Social, the Following and the Distrust. These segments together constitute to 50% of the Swedish population. In addition, this specific population satisfies their needs more and more just by the use of digital media alternatives and new types of formats. Therefore, the population uses the traditional news sites less. However, this is because of the result of links from search engines or social media.

There are also interesting differences in how social media is being used between the segments that traditional media finds difficult to reach. These include:

  • The Social gladly share news in social media to build and maintain relationships. Therefore, strengthening their own brand by appearing intelligent.
  • The Following consume a lot of news digitally, much like the Social. However, they are not sharing news as much as them.
  • The Distrust are happy to share news in social media. However, it is mainly to show their position or convince others of their opinion.

READ ALSO: What is brand tracking and why is it important?

Perceived value for the quality associations

The study shows that there are multiple ways to attract the groups that are currently not addressed by traditional media. The three most traditional segments appreciates three things the most; the depth of sources, the engagement of opinion-journalism, and having more context than the other. This is something that the segments feel they get today.

Therefore, in order to attract the three segments, traditional media needs enhancements of characteristics within the following areas:

  • The Distrust – “exclusiveness and context”, “depth of sources and references”, and “professional journalists/co-workers”
  • The Social –  “exclusiveness and personalized content,” “content via audio and video”, and “useful in everyday life and work”
  • The Following – “supplementary content services and benefits” and “depth and context”

Thomas Berthelsen
Head of R&D at Nepa